 Get Started midas Civil
 Featured blog of this week

Please fill out the Download Section (Click here) below the Comment Section to download the Full Webinar PDF File
In June 2020, we hosted a webinar, “How I Design Bridge : Load Rating of Steel U-Through Bridge" by Abdullah Zaid, Senior Engineer/SMEC.
Generally, we have aging structures for more than 50~100 years. And these structure has more increased loading along with the development. There are a few cases of bridge collapse due to overloading. Therefore, we need to manage the structures in the perspective of asset management efficiency. So, Load Rating is necessary.
In this session, Abdullah Zaid from SMEC shared the presentation regarding the load rating of steel U-through bridge. He walked through about load rating and the application based on his previous experiences.
We highly recommend this session to all bridge designers who want to understand levels of bridge investigations, load rating, and fatigue assessment around the world.
Key Points
1. Assessment levels for bridges
Bridge maintenance is the important element of bridge life cycle. There are various levels of bridge assessment. Dr. Abdullah discussed the types and levels of bridge assessments based on Australian practice.
2. Loads and Load rating
New bridges are generally designed for a conservative idealized vehicle arrangements such as SM1600 and 300LA for road and rail bridges. The load rating of existing structures might include the idealized vehicles, but more importantly it should include an actual type of loads within the bridge. The speaker shared steel-U girder bridge assessment project which applied the actual type of loads for load rating.
3. Fatigue assessment
Structural elements are generally designed under the ultimate limit state. When a load is repeated thousands/ millions of times, despite the sufficient capacity for ULS load. Fatigue failure might control the design. The speaker discussed the importance of fatigue assessment and demonstrated an example from practice.
Assessment levels for bridges
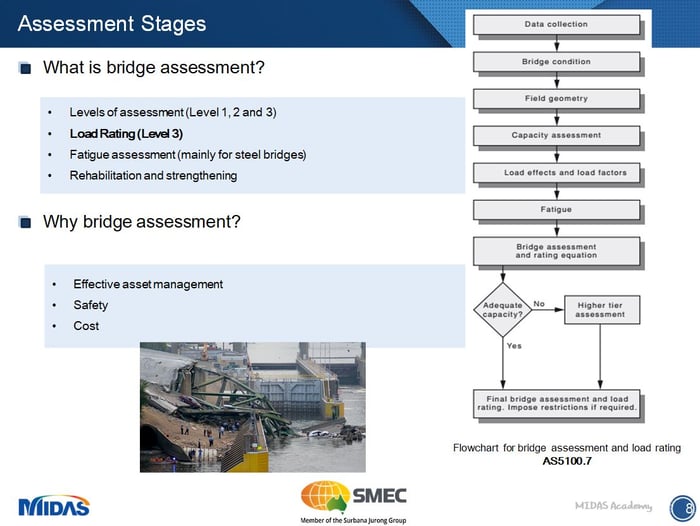
The flowchart for the bridge assessment and the load rating is provided in each national design code. But generally, we have levels of assessment and it consists of 3 levels.
- Level 1. To check the general serviceability of the structure, and identifying any emerging problems.
- Level 2. Comprehensive visual inspection, To rate the condition of the bridge components.
- Level 3. Detailed engineering investigations, Field investigation and structural analysis. The load rating is included in this level and Fatigue assessment as well.
Load Rating
When we undertake the load rating we have different steps as well. Several steps regarding the load rating are shown below.
1. As-new load rating
This is to check the structure using design load and as-built drawing based on design condition.
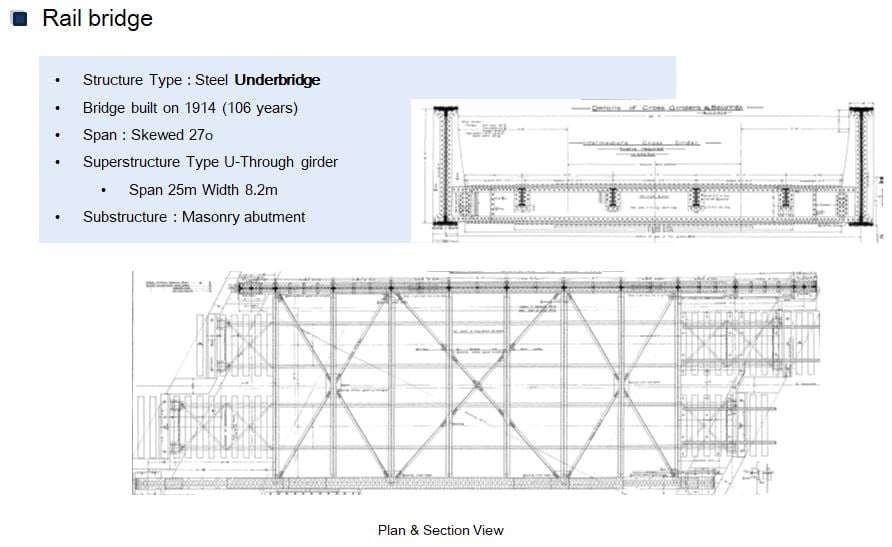
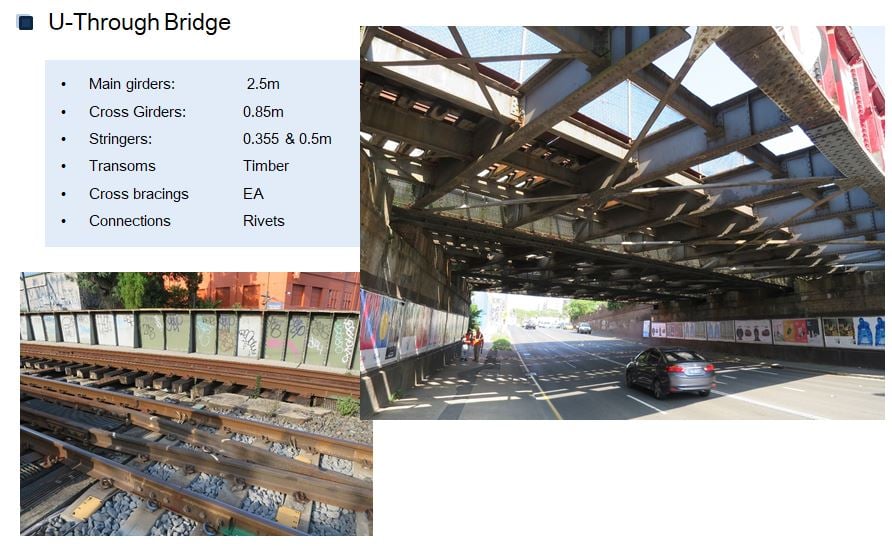
Fig. Design Condition of Example bridge
2. Structural mapping and condition assessment
This is to check the structure in the existing condition. Check lists have a section state, loads, crack, new member, and etc..
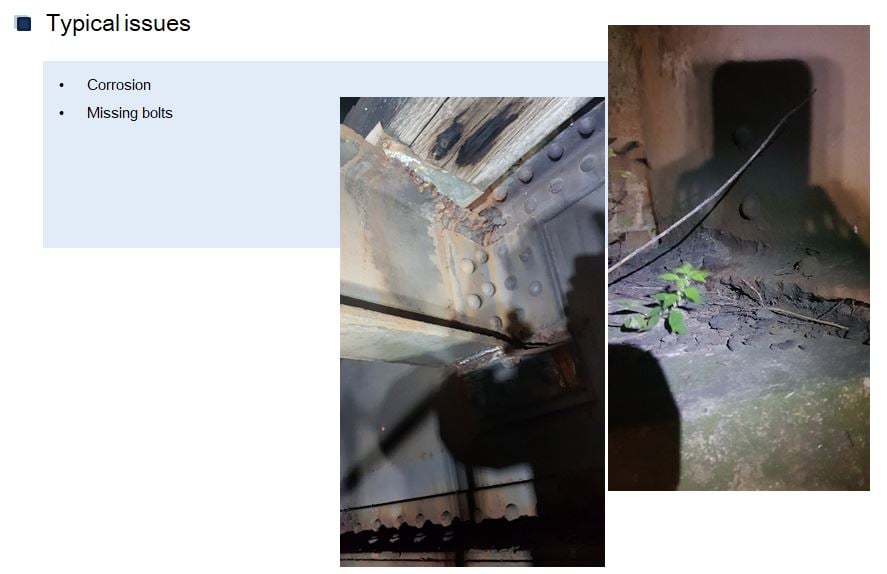
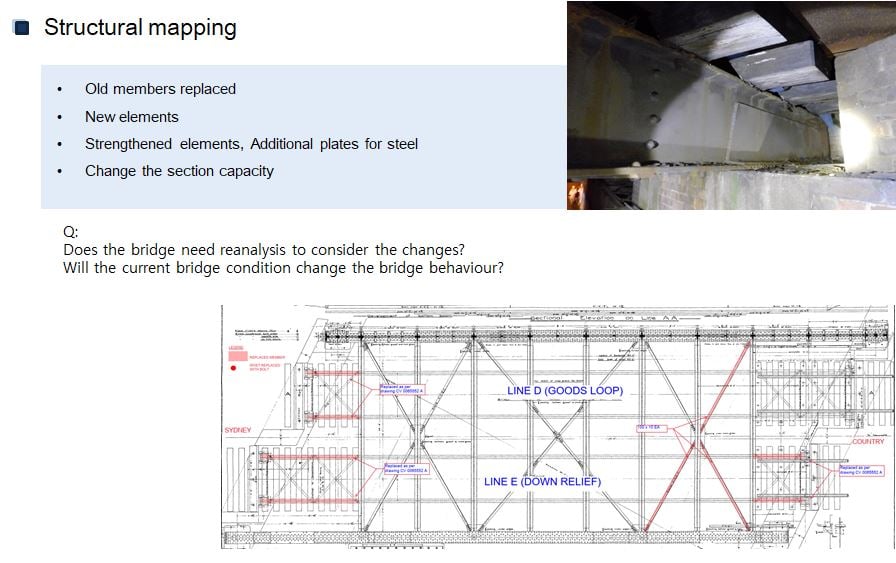
Fig. Structural Mapping of Example bridge
3. As-is load rating.
This is to check the structure considering the existing condition.
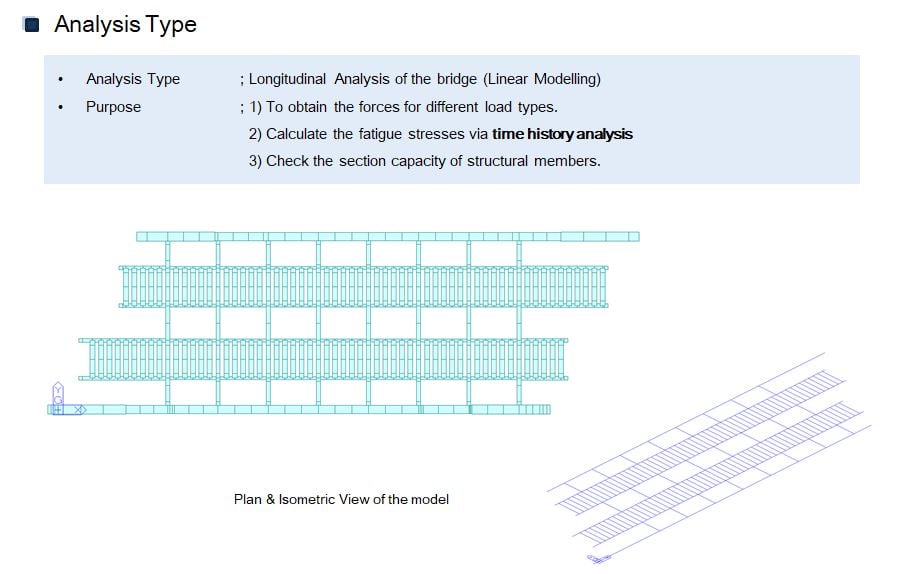
Fig. As-is Load Rating of Example bridge
4. Fatigue assessment
This is to check the fatigue life of each bridge component as well as the residual life of the bridge.
Fatigue Assessment
A given loading may be repeated many times, provided that the stresses remain in the elastic range. Such a conclusion is correct for loadings repeated a few times. However, it is not correct when loadings are repeated thousands or millions of times. In such cases, the rupture will occur at a stress much lower than static breaking strength. This phenomenon is known as fatigue. Repetitive loading cycles and or over-stressing of steel members can eventually lead to fatigue cracking and potentially to brittle failure.
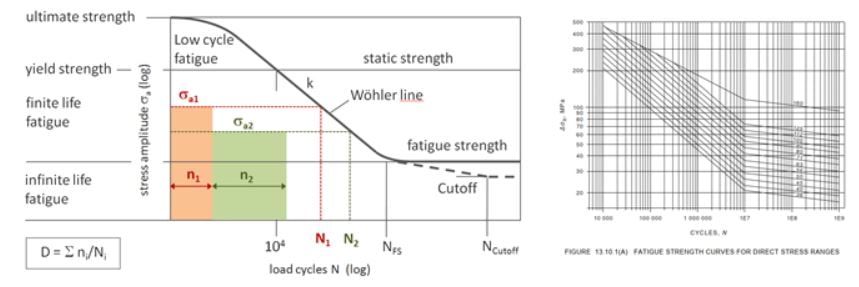
Fig. Fatigue Strength Curves for Direct Stress Ranges
Moving load analysis in midas Civil uses influence line method and the results show the forces envelop. This is useful for the design as the maximum forces govern the design. For fatigue assessment, the calculation requires no only the maximum forces, but rather to historical stresses at the element results from the moving load. The fatigue analysis looks at the stress fluctuation due to the moving load at specific point. Therefore, Time History Analysis is undertaken.
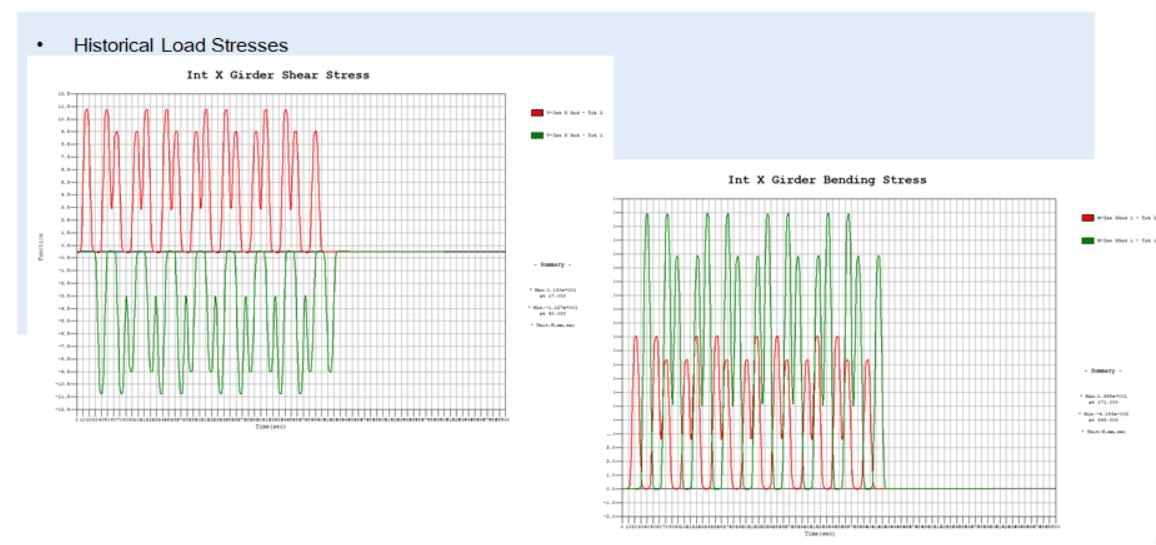
Fig. Fatigue Stresses


/Load%20Rating%20of%20Steel%20U-Through%20Bridge/Abdullah%20Zaid.jpg)


/Load%20Rating%20of%20Steel%20U-Through%20Bridge/6_Load%20Rating%20of%20Steel%20U-Through%20Bridge.jpg)

/Time%20History%20Analysis%20of%20Steel%20U-Girder%20Bridge/Time%20History%20Analysis%20of%20Steel%20U-Girder%20Bridge%20345%20240.png)

/design%20of%20steel%20composite%20bridge/Steel%20Ladder%20Deck%20Bridge%20Design%20-%20original%20345%20240.png)