 Get Started midas Civil
 Featured blog of this week

Why do we need pushover analysis?
Please fill out the Download Section (Click here) below the Comment Section to download the Complete Guide to Composite Sections
Table of Contents
2. Pushover Analysis vs Conventional Seismic Analysis
4. Methods of Pushover Analysis
5. Pushover Analysis in Midas Civil
6. Result of Pushover Analysis
The limitations of linear static analysis in the seismic design gave rise to non-linear static analysis or Pushover analysis. Pushover analysis can demonstrate how progressive failure in buildings really occurs and identify the mode of final failure. Pushover Analysis can also predict potential weak areas in the structure, by tracking the sequence of damages of every member in the structure (using something called ‘hinges’).
It then becomes prudent to perform a Pushover analysis to evaluate overall structural behaviors and performance characteristics.
Various steps to perform Pushover analysis in midas Civil is presented in the article in a concise way. The capacity curve, demand curve and the status of hinge is considered.
1. Need for pushover analysis
With the advent of Finite Element softwares in the world of seismic engineering, we have reached a stage where seismic design based on linear elastic analysis is no longer sufficient and a dedicated non-linear analysis of the structure is required.
Linear approach uses the concept of Response Reduction factor R. When we design a structure for say, R=3, it implies that only 1/3rd of the seismic force is taken by the Limit State Capacity of the structure and further deflection is taken by the ductile capacity of the structure. However, we rarely analyze for the ductile part, and only fulfil the reinforcement detailing guidelines for the part. This is due to various challenges faced while analyzing the ductile capacity, such as: change in stiffness of elements due to cracking and yielding, P-delta effects, change in the final estimated seismic force etc.
Elastic analysis fails to account for the resulting redistribution of forces during the progressive yielding or even predict the failure mechanisms in the structure. A non-linear static analysis which considers the inelastic behavior of the structure can predict these more accurately.
The need for this non-linear analysis to predict the performance of the structure beyond elastic limit gave rise to Pushover analysis (PA). Using this method, we can demonstrate how progressive failure in buildings really occurs and identify the mode of final failure. Pushover Analysis can also predict potential weak areas in the structure, by tracking the sequence of damages of every member in the structure (using something called ‘hinges’).
Pushover analysis can provide the following advantages: -
a) It allows us to evaluate overall structural behaviors and performance characteristics.
b) It enables us to investigate the sequential formation of plastic hinges in the individual structural elements constituting the entire structure.
c) When a structure is to be strengthened through a rehabilitation process, it allows us to selectively reinforce only the required members, thereby maximizing the cost efficiency.
2. Pushover Analysis vs Conventional Seismic Analysis
Let us see some of the similarities and differences between conventional seismic analysis (SA) and Pushover Analysis (PA). We will begin with the similarities.
• In both, conventional Seismic analysis (SA) and Pushover analysis (PA), we apply lateral load on the structure based on a predefined vertical distribution pattern.
In SA, the distribution pattern is either parabolic (Seismic Coefficient Method) or proportional to the Modal combination (Response Spectrum).
However, in PA, the distribution pattern is proportional to the height raised to the power of ‘k’ (where k can be ‘0’ (uniform), ‘1’ (linear), ‘2’ (parabolic), or anywhere between 1 and 2 (FEMA 356)).
• In both SA and PA, the maximum lateral load that can be taken by the structure depends upon the fundamental time-period of the structure.
With that idea, let us discuss some of differences between the two methods: -
• The most significant difference between the two methods is that SA is based on an elastic model while PA uses a non-linear model. The non-linearity in the model is introduced in the form of non-linear hinges in Midas Civil.
• During conventional Seismic analysis, the structure is analyzed and designed based on elastic forces such as moment, shear and axial forces, however, during PA, the result generated is the Base shear (Vb) vs Roof top displacement (Δroof top, displacement of a point on the roof, located in plan at the center of mass).
• Linear Superposition principle is valid for SA (linear), however, since PA is non-linear, the dead loads and live loads (lateral load) are applied sequentially in a single analysis.
• Conventional Seismic Analysis results are mostly used for design of structure, thus the loads available in the load combinations are factored, however, PA simulates the behavior of the structure under actual loads, therefore, the loads applied are not factored.
3. Pushover Hinges
Pushover hinges are points of high flexural (or shear) deformations in a structure. These are points where the cracking and yielding is expected to occur at a higher intensity as the members approaches its ultimate strength.
Pushover hinges are of several types – flexural hinges, shear hinges and axial hinges. At the ends of beams and columns in a structure, we provide flexural and shear hinges. Axial hinges are usually provided at the ends of diagonal struts which are modelled during Pushover analysis to simulate the infill masonry walls in a structure. Figure 1 below shows the usual position of flexural, shear and axial hinges in a typical structural frame.
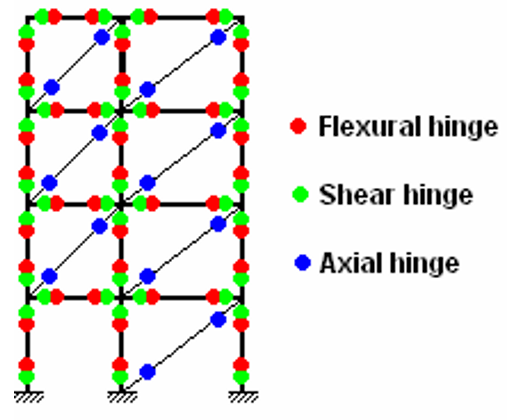
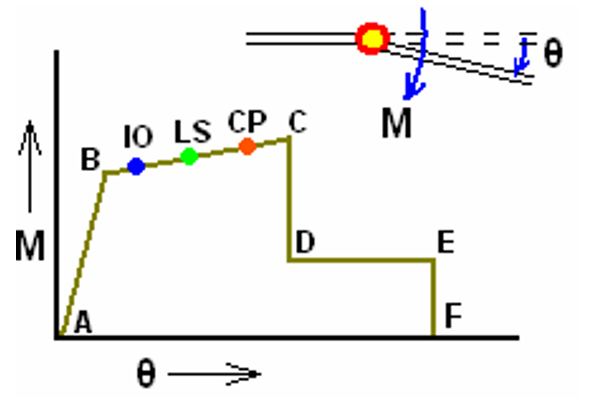
Figure 2 represents a typical flexural hinge for which the Moment-rotation relation is shown. AB is the zone when the structure behaves as linear and elastic. Point A is the unloaded state and Point B represents the yield state. Beyond Point B to Point C, the structure behaves as linear but inelastic. In this zone, the stiffness of the structure decreases. From Point C to D, there is a sudden drop in the resistance of the structure. This is followed by a total loss of resistance from Point E to Point F.
When the member lies in zone BC, i.e. in the ductile region, the nonlinear hinges go through 3 stages : Immediate Occupancy , Life Safety and Collapse Prevention.
4. Methods of Pushover Analysis
There are various methods of Pushover analysis: -
- 1) Displacement Coefficient Method:
Here, the target displacement is calculated which can be the maximum translational displacement for global modal or it could be the displacement for a specific node (called the master node in Midas Civil).
FEMA 356 and Eurocode 8 (EN 1998-1, 2003) follows this approach for Pushover analysis.
- 2) Capacity Spectrum Method:
In this method, the load is incremented gradually, and the hinge condition is checked at each stage, until we reach the ‘Performance Point’ condition.
This method of Pushover analysis is adopted by ATC-40.
FEMA 440 is an improvement in the procedure of Pushover analysis for both the above methods.
5. Pushover Analysis in midas Civil
While codes like FEMA-356, ATC-40 and FEMA-440 provide the chart for the hinge properties for the flexural hinges, the exact hinge properties (accurate M-phi curve) require the details of reinforcement provided in the member.
Using various concrete models such as, Confined Mander Model present in Finite Element softwares like Midas Civil, we can generate exact M-phi curve. However, for a RC member, reinforcement details can only be obtained when the member is designed. This implies that Pushover analysis is a second order analysis.
To summarize, for performing accurate seismic design, we need to perform the following steps sequentially: -
- a) Conventional seismic analysis like Response Spectrum analysis is performed. Results obtained during analysis are used for initial structural design and provides reinforcement required in a RC section.
- b) Hinge property is calculated in Midas Civil.
- c) The hinges are then inserted into beams, columns etc. at required positions.
- d) Pushover analysis is carried out.
- e) The design and reinforcement detailing of the section is changed to generate the final result.
Sample Model used for Pushover Analysis in Midas Civil:-
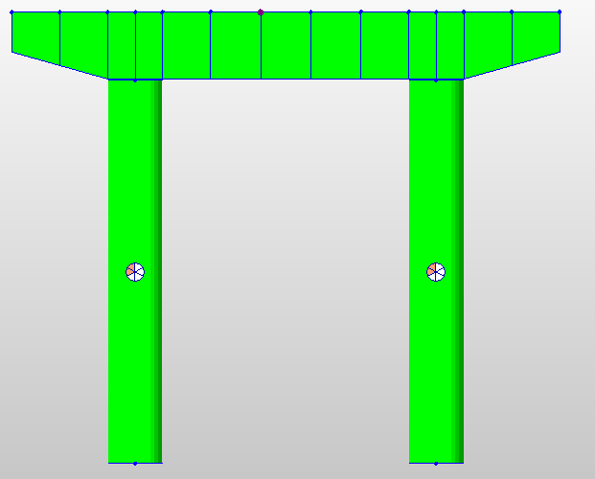
Figure 3 below shows a typical pier / pier cap section on which Pushover analysis is performed.
Steps Involved:-
- 1) Moment Curvature Analysis with GSD
Midas Civil offers a built software, General Section Designed (GSD) to find the Moment-curvature function for the cross-section of the pier.
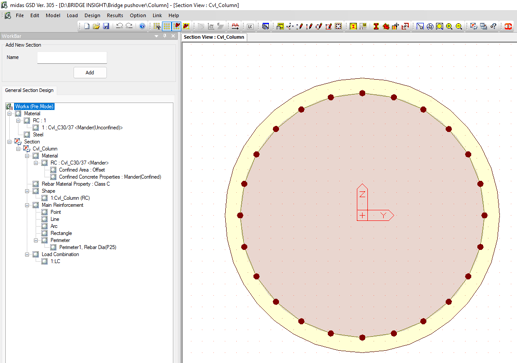
- - Generate a section in Midas GSD.
- - Define material properties for concrete and rebars.
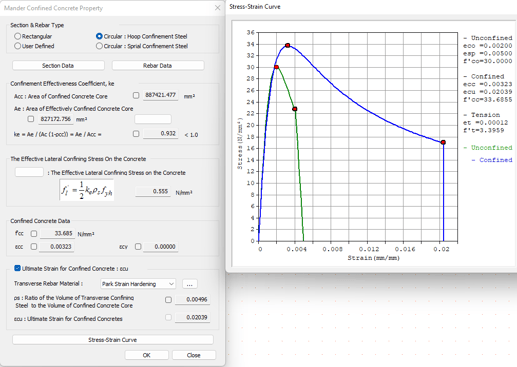
- Assign rebars to the section
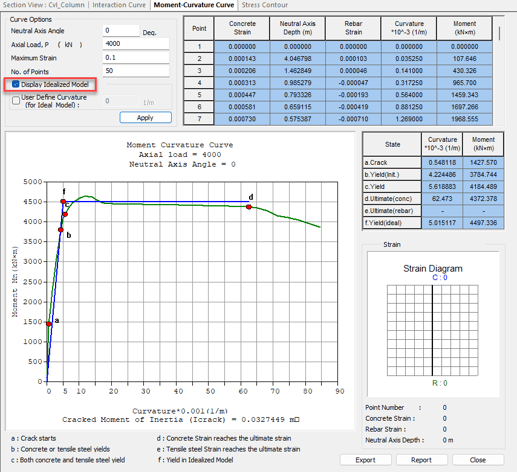
Analyze the section in GSD to generate M-phi curve.
Make sure to check on the ‘Display Idealized Model’ option in order to export hinge properties to Midas Civil as shown in Figure 6.
2) Export Hinge properties to Midas Civil
- Hinge data is automatically exported to Midas Civil by clicking the OK button.
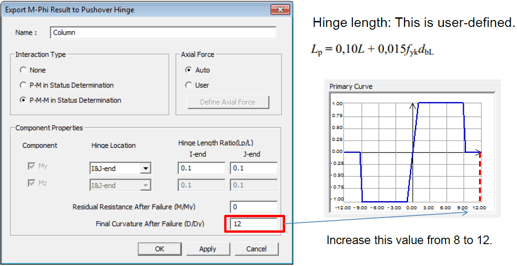
3) Import Hinge Properties to Midas Civil
- Hinge property is imported to Midas Civil as Moment-curvature type and Hinge length is checked on to assign pushover hinge to the specified hinge length.
- P-M-M Interaction is chosen where coupled axial force-biaxial moment behavior is reflected by calculating the flexural yield strength of a hinge considering the effect of axial force.

-
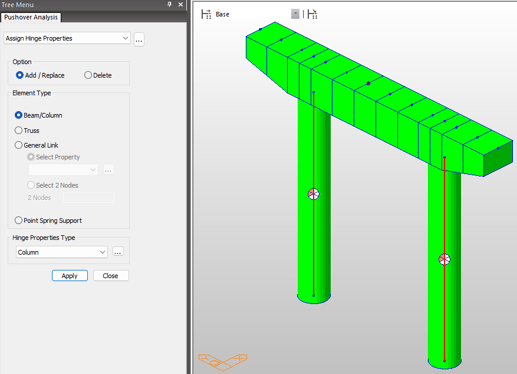
4) Assign hinge properties to Columns
-
Pushover hinge is assigned to both the columns
-
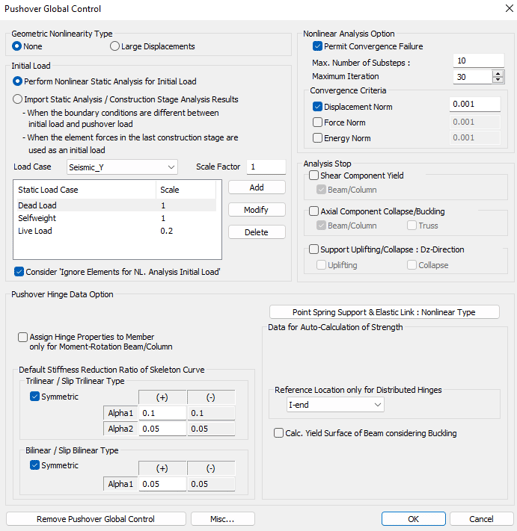
5) Define Pushover Global Control
-
We define the necessary conditions to be applied to Pushover analysis such as such as Geometric Nonlinearity type, Initial Load, Convergence criteria, stiffness reduction ratio etc.
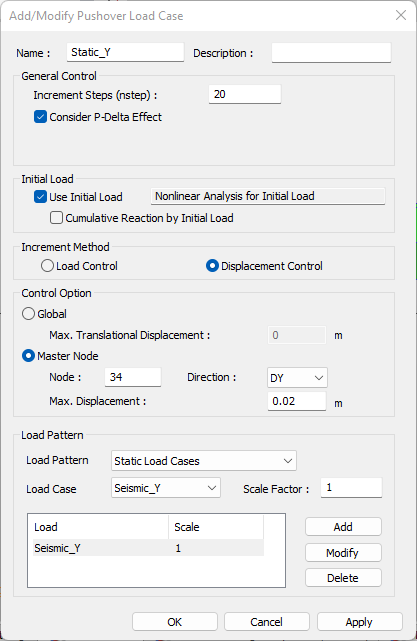
- 6) Define Pushover Load Case
- Pushover Load Case has been defined as Displacement Control in Transverse direction.
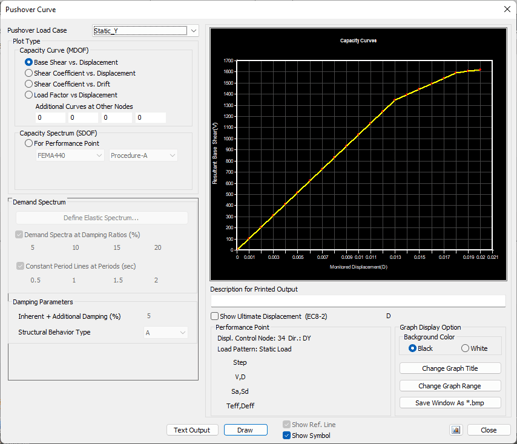
6. RESULT of pushover analysis
-
Using the interaction of the base shear and the displacements calculated from the results of a Pushover analysis, the capacity curve and capacity spectrum of a structure are calculated.
-
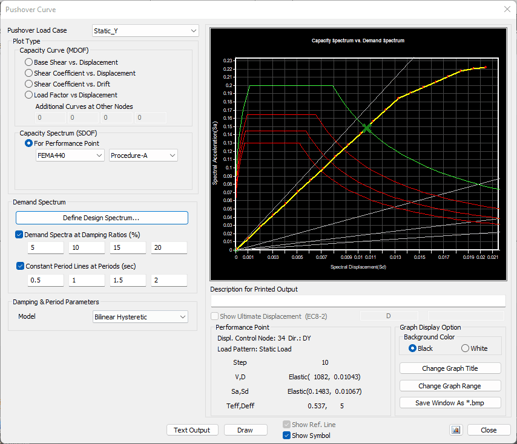
The demand spectrum is also generated for a design seismic load using the design response spectrum.
-
The Performance Point, which represents the state of maximum inelastic capacity of the structure, is found through the cross point of the Capacity Spectrum and Demand Spectrum for a given damping ratio.


.png)


.png)