 Get Started midas Civil
 Featured blog of this week

Significance of Influence Line Diagram
Please fill out the Download Section (Click here) below the Comment Section to download the Model File!
Table of Contents
2. Influence Line Diagram Generation
1. Introduction
Let us start with a question, how to determine the vehicle position on a single lane for the governing forces in an element? The usual procedure followed by several engineers is to run a train of vehicles on a defined lane as close to each other (at a minimum distance) and get the position for maximum effect.
The above-mentioned procedure may not give the desired results for all kinds of structures. The correct way would be to find the influence line diagram along the given structure for the element under consideration and place the vehicles such that the maximum effect can be produced on the element (positive influence area).
Before moving forward let me define the influence line diagram (ILD), which is the variation of forces in an element or at a node due to the movement of unit force along the span of the structure.
Now, we have some idea about the importance of ILD, in the next section, we will understand how to generate the influence line diagram for a given structure.
2. Influence Line Diagram Generation
There are mainly two approaches for generating an ILD,
a. Static Equilibrium method,
b. Muller Breslau’s Principle,
Although the approaches are the same for determinate and indeterminate structures, additional equations (compatibility) are required to get the results for the indeterminate structures as the influence line diagrams are of nonlinear nature for the latter.
Let us understand this with simple examples for each of the above methods,
Method1: Static Equilibrium
Method1: Static Equilibrium
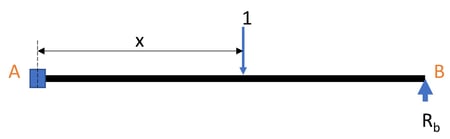 Fig1. Indeterminate beam
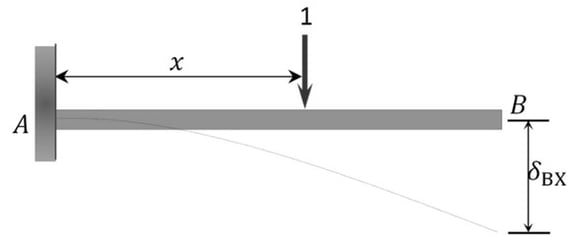
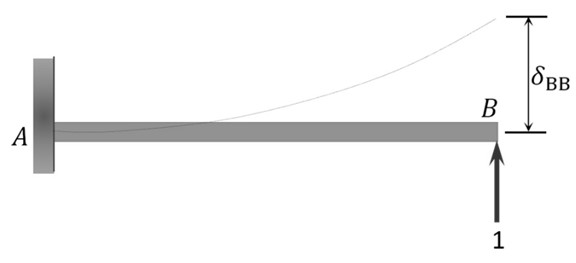
From the principle of consistent deformation (superposition of fig2 & fig3),
From equation 1, the value of Rb for different x along the beam can be obtained. Furthermore, using the equilibrium equations Ra and Ma can be obtained for different values of x along the beam.
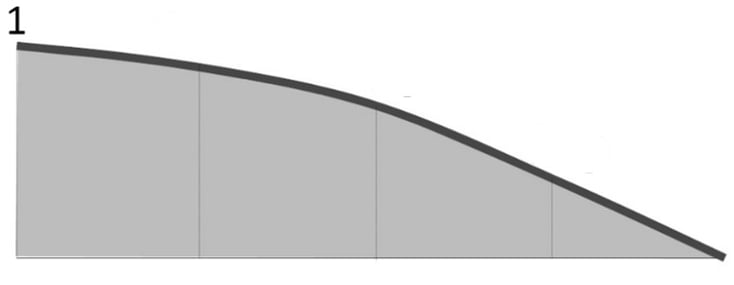
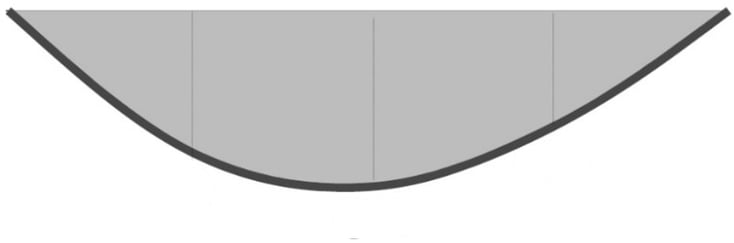
The final influence line diagrams for Ra, Rb, and Ma are as follows.
Method2: Muller Breslau’s Principle
Procedure for Analysis of Influence Lines by the Muller Breslau’s Principle,
1. Obtain the released structure by removing the restraint (remove supports, shear resistance (vertical rollers), moment resistance (hinges)) that corresponds to the function whose influence line is desired and apply a unit displacement or rotation to the released structure at the point of interest,
2. Draw the deflected shape of the released structure. This corresponds to the influence line of the function being considered,
3. Place a unit load at the location and in the direction of the function being considered, and find the value of the ordinate of the influence line using statics,
4. Determine the value of other ordinates of influence using geometry.
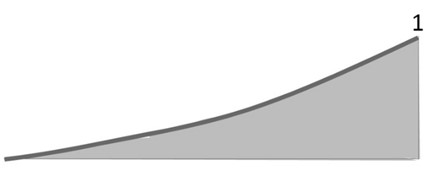
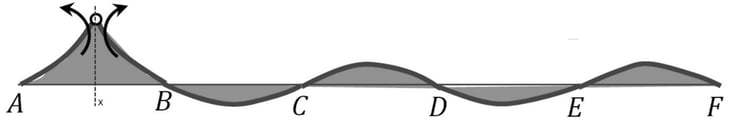
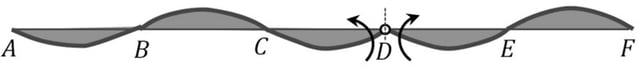
The qualitative ILDs for multi-span structure are shown in the figures below.
3. Analytical Study
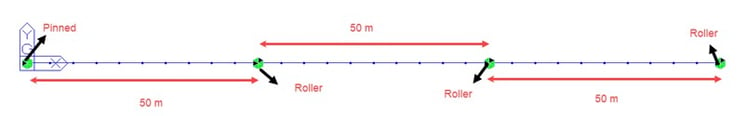
We have seen the theoretical calculation for the determination of the influence line diagram for the indeterminate structures. Let us compare the structure with moving loads placed such that the maximum sagging and hogging effects can be determined. The structure is a 3-span continuous beam of 50 m each, with pinned and roller supports as shown in the image below.
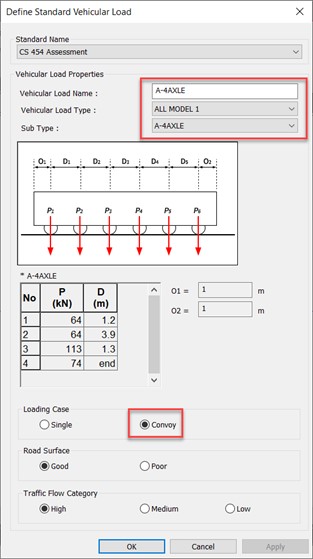
The structure is analysed for the moving loads only and it is loaded with All Model1 A-4AXLE convoy vehicles (CS454) along the centreline of the span.
The two load cases are compared to get the maximum sagging moment in the structure,
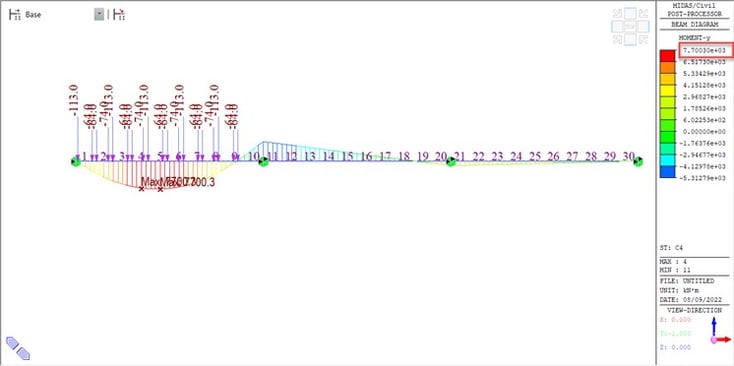
Case1. When the vehicle position is placed such that the distance between the two vehicle groups is kept fixed minimum (3 m),
In this case, only one span of the structure is loaded to get the maximum effect as shown in the figure below. The maximum sagging bending moment for this case is 7700.3 kN-m.
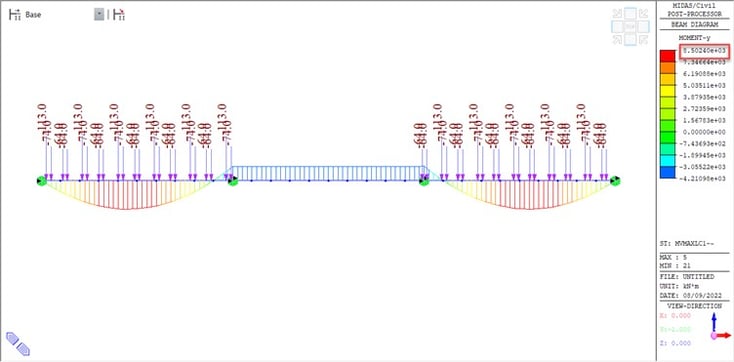
Case2: When the vehicle position is placed such that the distance between the two vehicle groups is kept variable.
In this case, both ends of the spans of the structure are loaded to get the maximum effect as shown in the figure below. The maximum sagging bending moment for this case is 8502.4 kN-m.
This creates a significant difference in the design bending moment demand for the structure.
Therefore, it is essential that the vehicles shall be placed as per the influence line diagram instead of keeping them at a fixed distance over the span of a bridge.
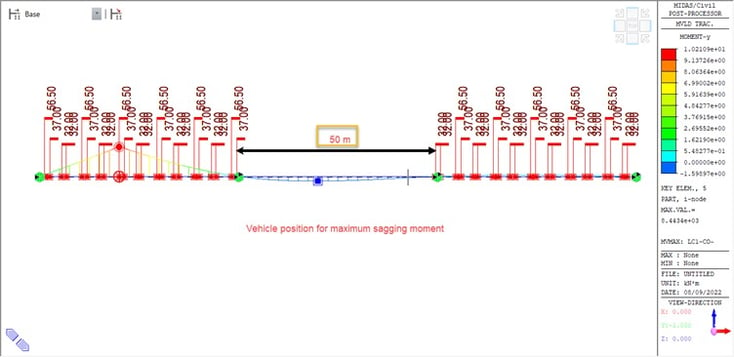
The vehicle load definition of midas civil incorporates this effect and includes all the possible governing vehicle positions for the force calculation. In the next exercise, the moving load is applied along the span of the structure as per the standard vehicular load definition for All Model1 A-4AXLE convoy vehicles available in midas civil as shown in the image below..
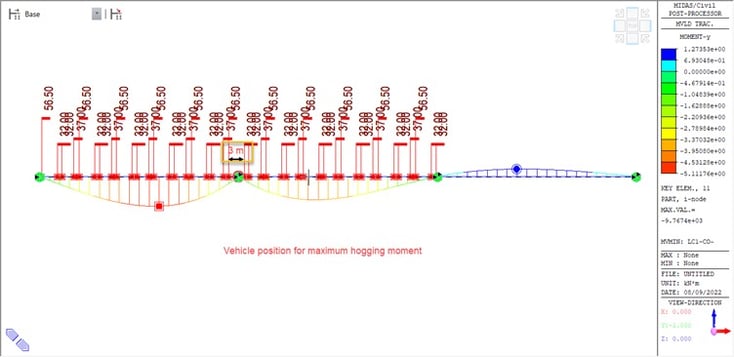
The vehicle positions for the maximum and minimum bending moment in the structure are as shown in the figures shown below. It is to be noted that to get the maximum effect the spacing between the two vehicles shall be kept varying (this is naturally done in midas civil) else desired governing effect cannot be achieved.
4. Results
The results of the two moving load cases, a. when the distance between vehicles is kept fixed, b. when the distance between vehicles is kept variable, is compared below.
|
Table1 |
Case1 |
Case2 |
|
BMy |
7700.3 kN-m |
8502.4 kN-m |
|
%age Diff |
9.43 % |
|
The difference is close to 10% which is significant, and it can further widen depending on the configuration of the structure.
5. Conclusions
Although we have considered a simplified case that is quite intuitive, while considering moving loads for a medium to long-span bridge with skewed or curved geometry it might be difficult to position the vehicles manually to get the maximum effect. Hence, to ensure better accuracy of the moving load analysis it is essential that the vehicular positions are decided based on the ILD of the structural elements.


.jpg)


.png)
.png)