 Get Started midas Civil
 Featured blog of this week

Please fill out the Download Section (Click here) below the Comment Section to download the Full Webinar PDF File
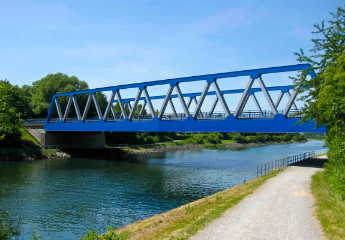
Steel composite footbridge Morava project is presented in this session. The structure is described with interesting remarks from the assembly. Practical experience on how to design footbridges that are sensitive to the load imposed by pedestrians is shared. After this session, bridge engineers will understand more deeply how to deal effectively with dynamically loaded bridges.
This webinar covers topics as listed below, regarding dynamic analysis on steel bridges
- Conversion loads to masses
- Eigenvalue analysis
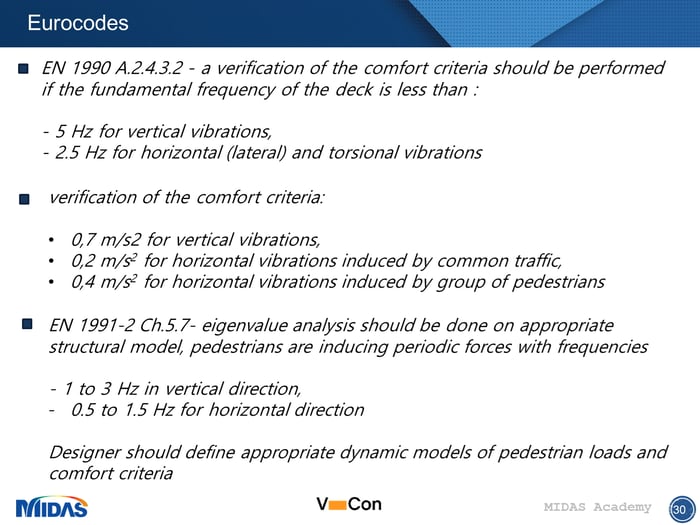
- Limits for the comfort of pedestrians
- Dynamic forces induced by humans
- Damping
- Time history analysis – crowded
- Harmonic analysis
- Interpretation of the results and comparison with testing
Eigenvalue Analysis
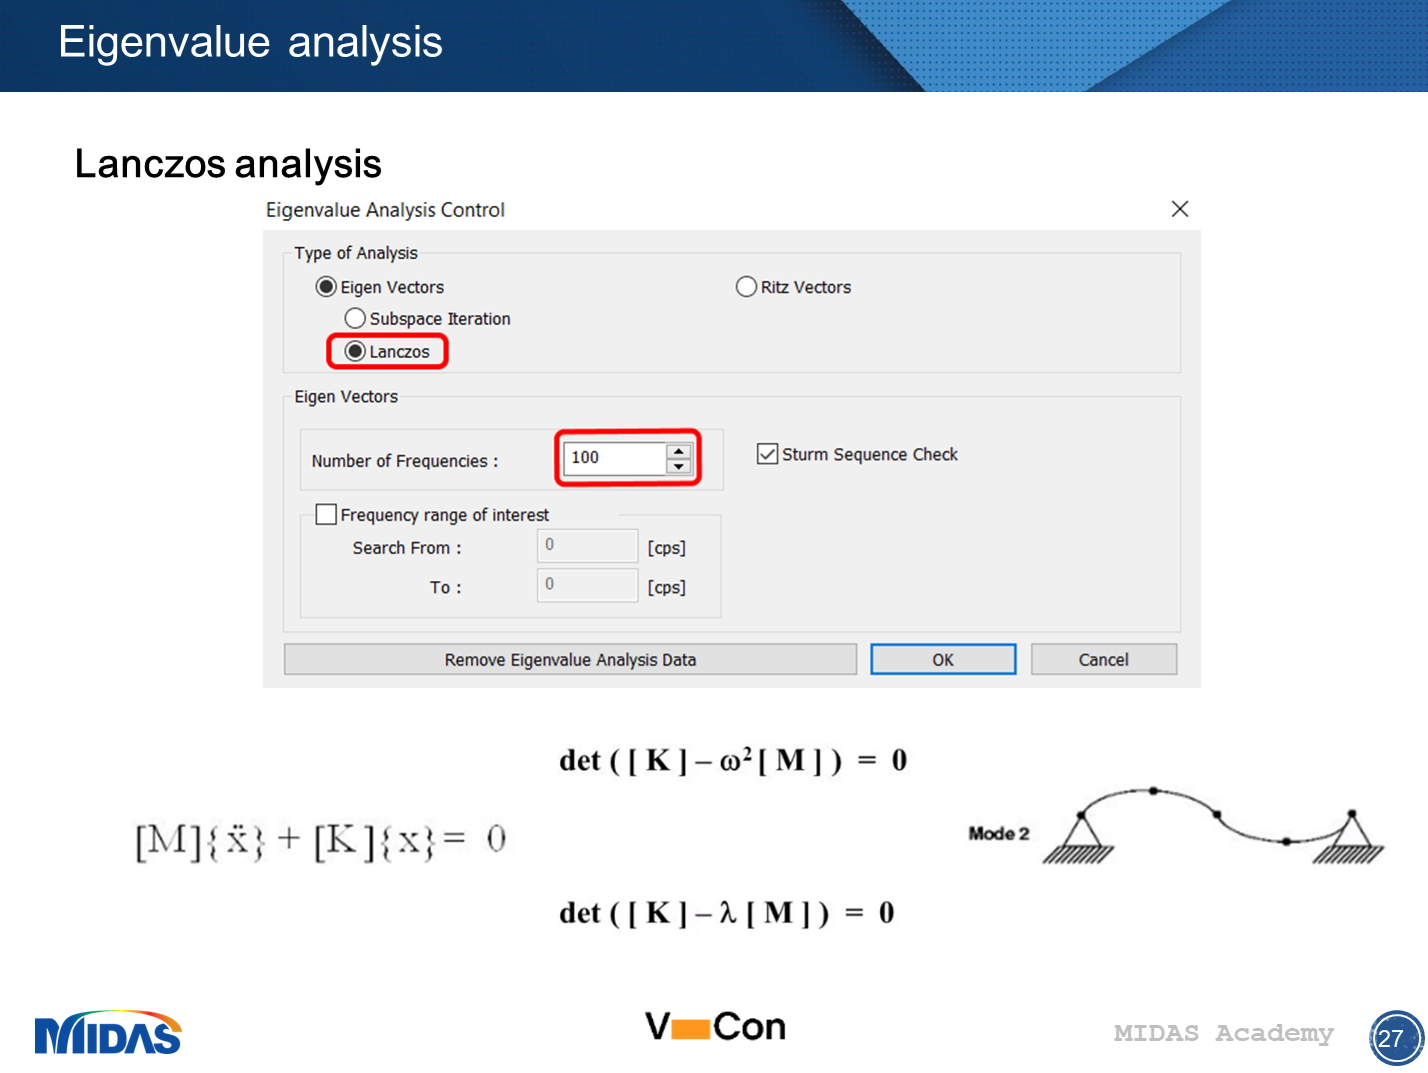
For analysis of the eigenvalues as periods, frequency, the angular frequency, and eigenshapes were selected Lanczos analysis. This method is effectively used when performing eigenvalue analysis for lower modes.
The determinant of the matrix is finding out the non-trivial solution of the homogeneous algebraic equations. According to amounts of degrees of freedom can be expressed the number of eigenvalues. The 100 mode shapes are sufficient for analysis of this type of footbridge and cover all significant modes for analysis.
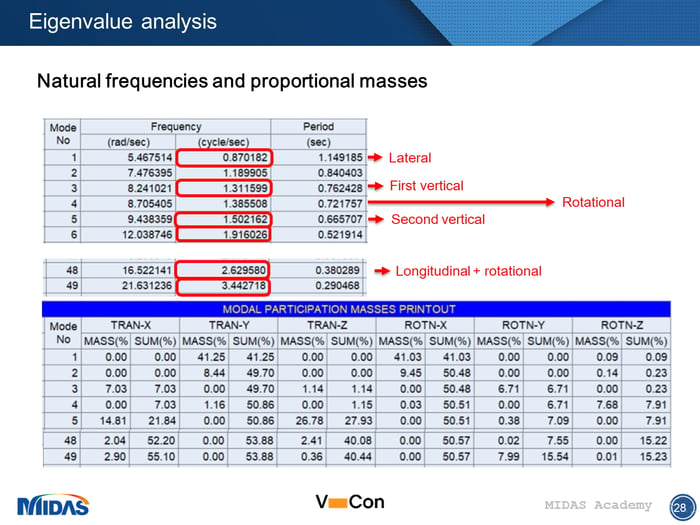
From the eigenvalue analysis are manually sorted out the lateral, vertical and rotational modes which are subsequently compared with the limit values. There is really important to say that more models were tried for the final comparison. These eigenmodes are without the effect of the composite concrete deck due to the fact of partially (flexible) co-acting between concrete deck and studs: this causes lower stiffness and a little bit smaller second vertical mode shape.
Dynamic force induced by humans
According to significance, location and amount of people going through is the footbridge sorted out to the Traffic class. This bridge received TC3 with dense traffic and an intensity of 0.5 p/m2. The most was also tested for different classes with more strict regulations from the point of view people and acceleration limit for comfort.
/Dynamic%20Analysis%20of%20Footbridges%20as%20per%20Eurocode/New%20images/%EC%9D%B4%EB%AF%B8%EC%A7%80%204.png?width=700&name=%EC%9D%B4%EB%AF%B8%EC%A7%80%204.png)
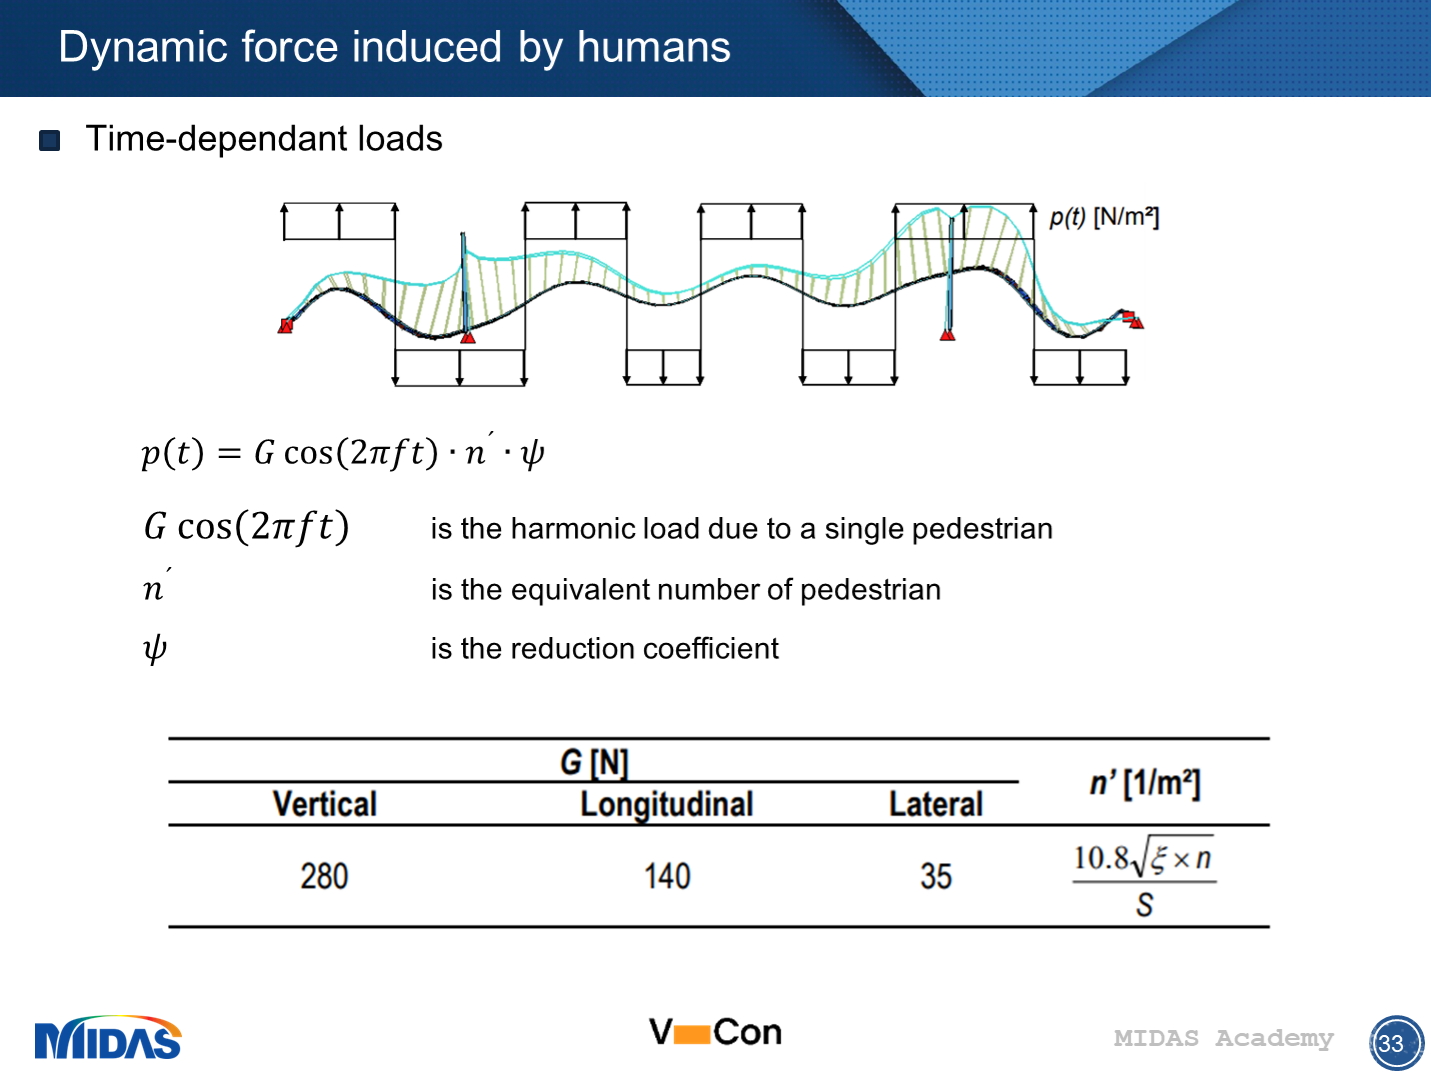
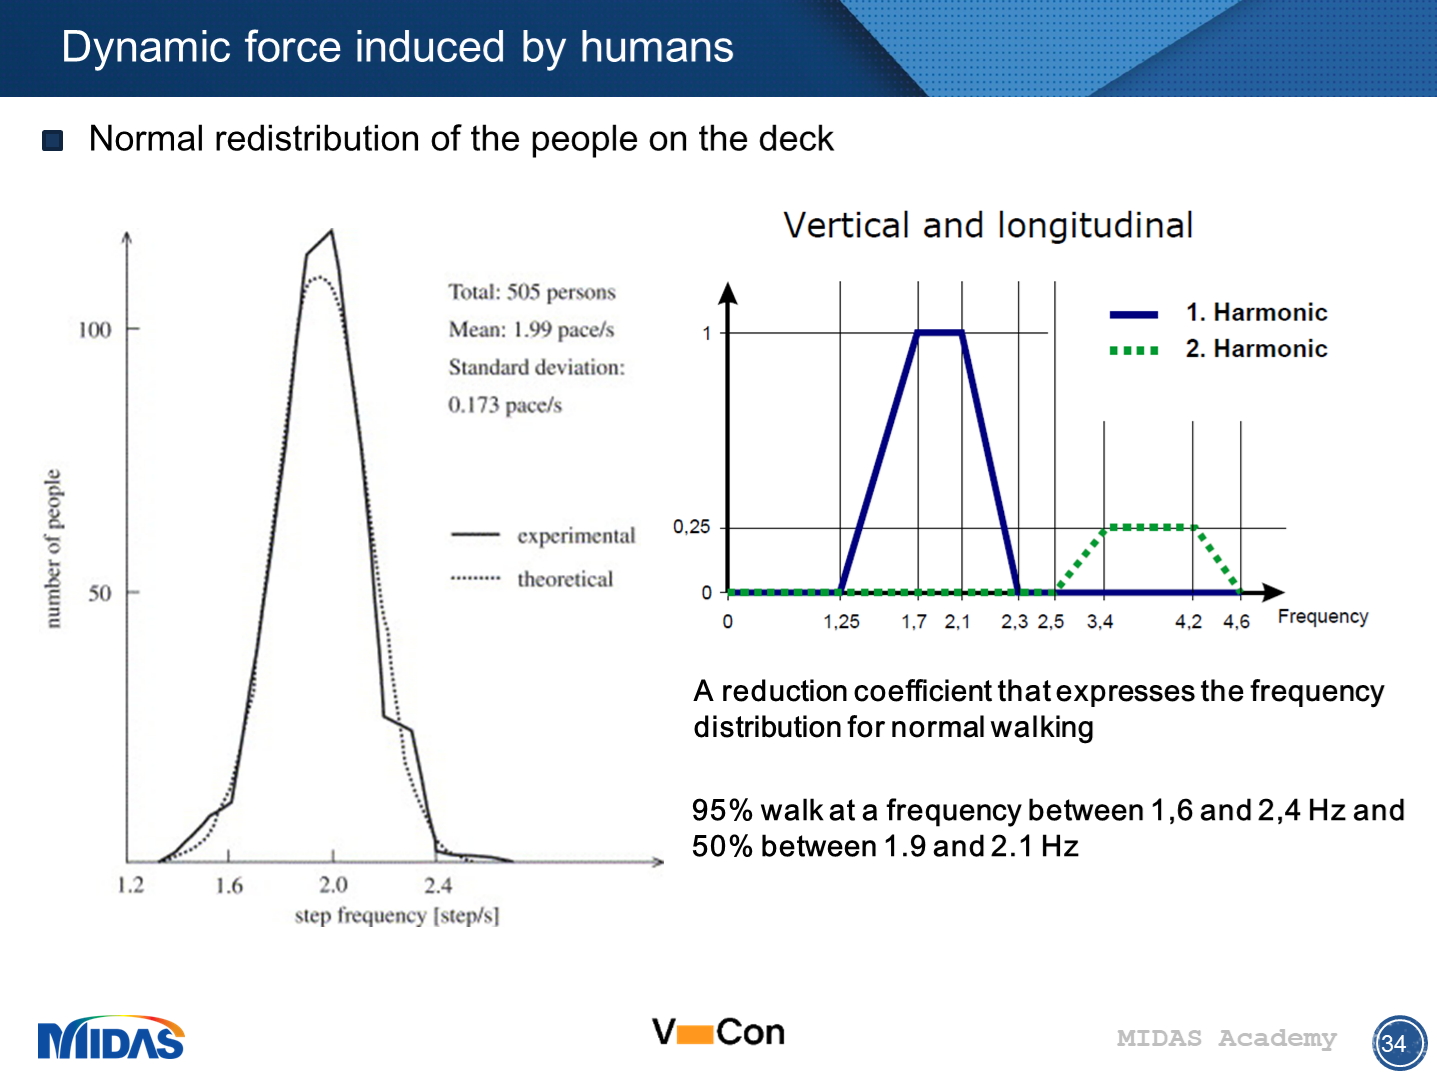
The analysis which is measuring the dependency between time and the force of the human is introduced now. The vertical force evoked by a human is the biggest one and the period is half opposite to lateral force. All three measurements are recorded to the graph and are fitting by Fourier series for creating the approximation for calculation. The Fourier series is displayed with the full line opposite to the experiment is represents by the dashed line.
/Dynamic%20Analysis%20of%20Footbridges%20as%20per%20Eurocode/New%20images/%EC%9D%B4%EB%AF%B8%EC%A7%80%205.png?width=700&name=%EC%9D%B4%EB%AF%B8%EC%A7%80%205.png)
In the method used, the pedestrian-induced action is represented as oscillating distributed load p(t). This load is applied in accordance with the mode shape, as shown in the figure.
ψ is the reduction coefficient to take into account the probability that the footfall frequency
y approaches the natural frequency under consideration. This factor will be discussed in the next slide
The load value depends on the crowd density and on the walking behavior. When the density is less than 1 P/m2, people are not interacting. If the density increases, free walking is no longer possible, and the interaction of walking people should be considered.
A reliable statistical description of normal walking frequencies was first given by Matsumoto et al., who investigated a sample of 505 persons.
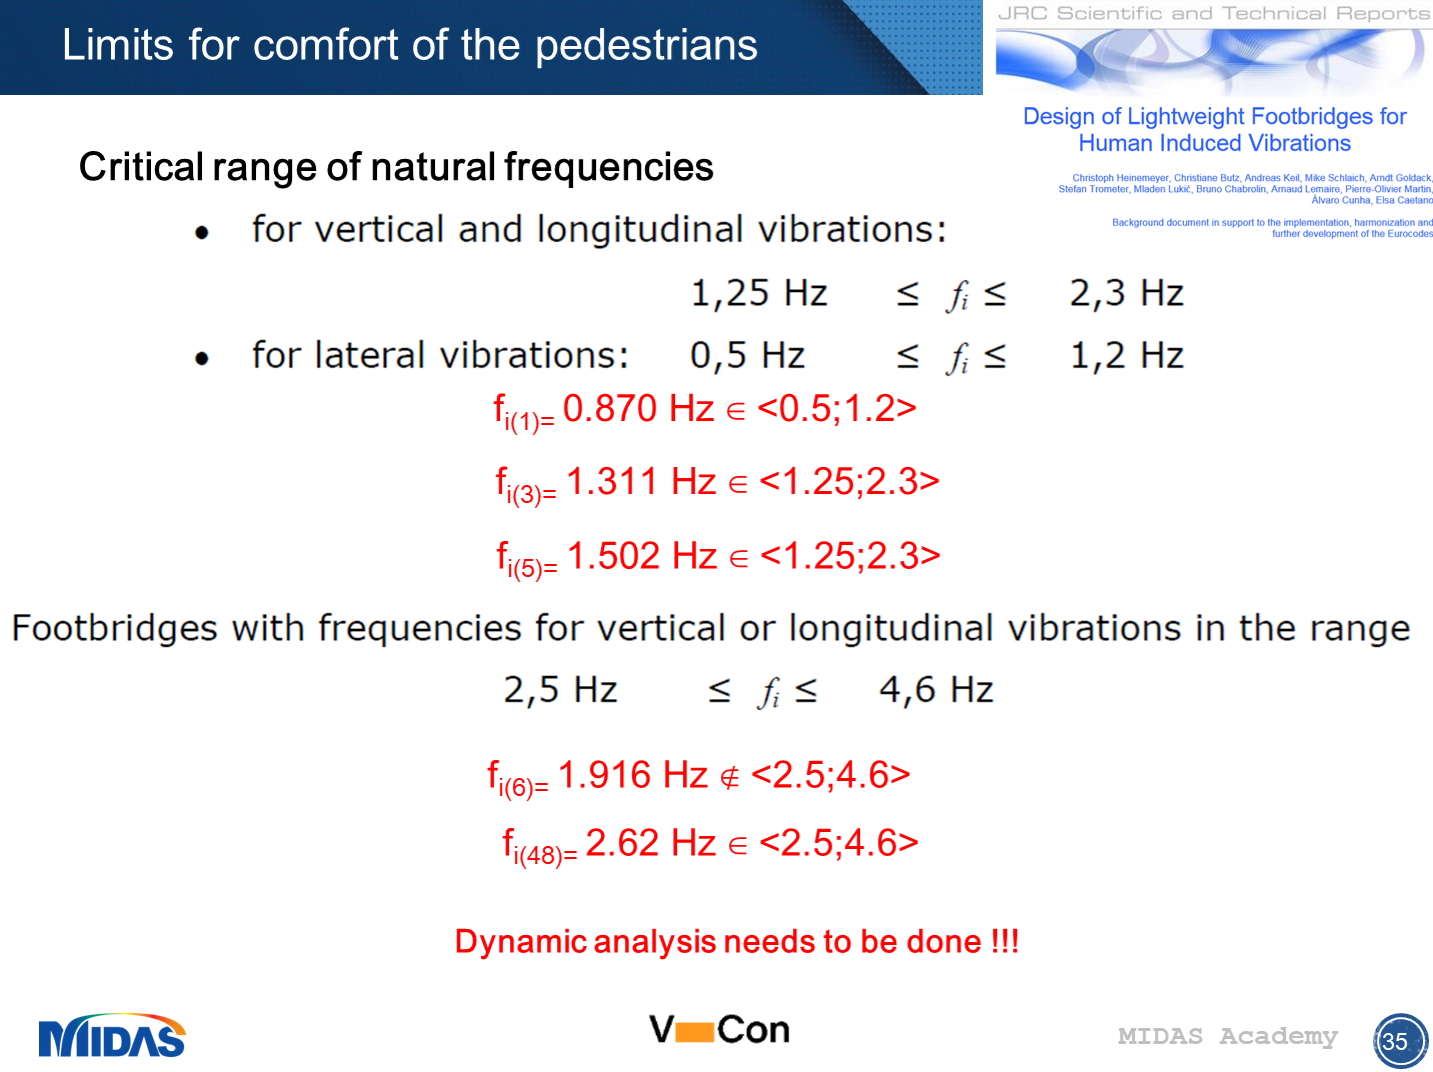
The limits for comfort are generally known for footbridges. The range comes out from the literature,, Design of lightweight footbridges for human-induced vibrations, with cooperation many authors.
For lateral mode, we are in the middle 0.870 Hz
Dynamic analysis needs to be performed.
Damping is an essential part of the design and looking for a spectrum of the response on the structure. The calculation takes into account mass and proportional damping what exactly means Raylih damping. The graph recognizes the dependency between damping ratio and angular frequency. The blue line is mass proportional – essential with low frequency
The red line shown is the stiffness proportional (welds, bolts, compositing) – rising up with increasing angular frequency.
/Dynamic%20Analysis%20of%20Footbridges%20as%20per%20Eurocode/New%20images/%EC%9D%B4%EB%AF%B8%EC%A7%80%206.png?width=700&name=%EC%9D%B4%EB%AF%B8%EC%A7%80%206.png)
Watch the full webinar video