 Get Started midas Civil
 Featured blog of this week

P-M Interaction Diagram: Circular Section
Table of Contents
1. Introduction
2. What is the P-M Interaction Curve
3. P-M Interaction Diagram: Circular Section (Downloadable Example)
*Please fill out the Download Section (Click here) below the Comment Section to download the P-M Interaction Diagram: Circular Section Excel VBA!
1. Introduction
The P-M interaction diagram/curve is used to design reinforced concrete members in which axial force and bending moment act simultaneously. The reason the P-M curve is needed for designing members in which axial force and bending moment act simultaneously is because the equilibrium equation “C=T” (C: Compression force, T: Tension force) of the internal couple does not hold due to the effect of the axial force. Therefore, the moment of the member to which the axial force acts should be calculated on the plastic centroid axis. In summary, a structural member supported only by bending moment and shear without axial force is called a beam, and a structural member with bending moment, shear, and axial force acting on it is called a column.
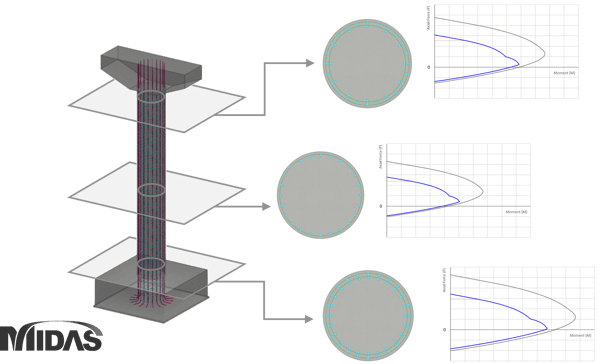
The figure below is an example of reinforcing bars by column position and the P-M curve that varies accordingly.
2. What is a P-M Interaction Curve?
The P-M interaction curve indicates the capacity for P and M that reinforced concrete can resist. Many programs can calculate the P-M required for design; MIDAS CIVIL is one of those programs and provides a function to create a P-M curve. Please refer to the link below for an explanation of the function for creating a P-M curve in MIDAS CIVIL.
[The Fundamentals of MIDAS General Section Designer (MIDASbridge.com)]
In the figure below, we have identified the important points for creating a P-M curve. Among them, the Balanced Point is the point that distinguishes the Compression Controlled Region and the Tension Controlled Region
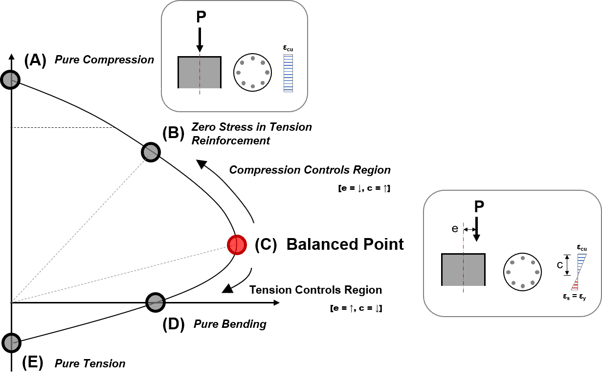 Figure 2. Description of P-M Interaction Curve
Since there are already many examples that can manually calculate each point, we will omit the explanation of the calculation method and mention only the points that are mainly necessary for the ACI 318-14 code used in the attached Excel File.
A. Pure Compression
In this case, only an axial force acts without a moment, so e=0, and theoretically c is infinite.
- Nominal axial compressive strength, Pn (ACI 318-14 Cl.22.4.2.1)
- Nominal axial strength at zero eccentricity, P0 (ACI 318-14 Cl.22.4.2.2)
B. Balanced Point
- Maximum strain at the extreme concrete compression fiber, εn (ACI 318-14 Cl.22.2.2.1)
- Depth of equivalent rectangular stress block, a (ACI 318-14 Cl.22.2.2.4.1)
- Distance from extreme compression fiber to the neutral axis, c (ACI 318-14 Cl.22.2.2.4.2)
- The factor relating the depth of equivalent rectangular compressive stress block to the depth of the neutral axis, β1 (ACI 318-14 Cl.22.2.2.4.3)
C. Pure Bending
In this case, the axial force (P) is 0, and the subject behaves like a beam. This point is also known as the Pure Moment, so the moment is 0. Through repeated calculations, the value of c can be found when the sum of the resistive force Fs of the rebar and the resistive force Fc of the concrete section becomes 0.
D. Pure Tension
In this case, since only axial tension acts, the concrete section cannot be resisted, and only the tensile force of the rebar is resisted.
When the shape of the cross-section becomes more complex, it is not easy for an engineer to directly create a P-M curve. When the engineer needs to determine the section at which the rebar changes, the P-M curve value for the rebar to be used can be calculated in advance and made into a sheet as shown in the figure below. By using the Excel sheet made in this way, the rebar section can be determined while visually viewing the D/C ratio of the entire monopile section.
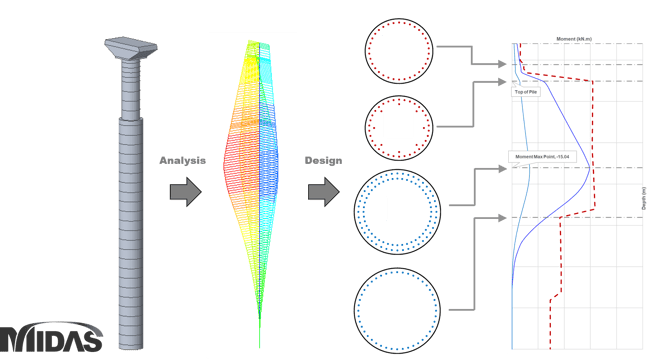 Figure 3. Mono-pile design using P-M curve
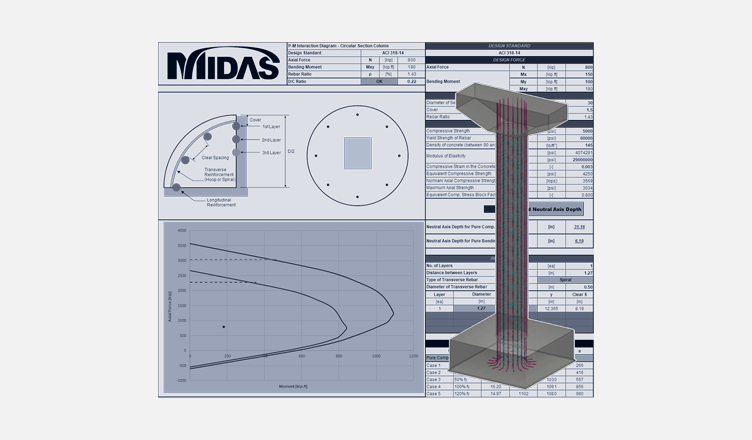
3. P-M Interaction Diagram Example: Circular Section
The following Excel file creates a P-M interaction diagram of a circular cross-section. The Excel file is made based on ACI 318-14 with SI units and US units appearing in separate sheets. The user can create a P-M interaction curve by entering the dimensions and rebar specifications of the cross-section to be reviewed and calculating the D/C ratio for the design load. For detailed design, it is always recommended to use a structural analysis program such as MIDAS CIVIL. The Excel file contains a VBA (Visual Basic Application) programming code for Excel, so please make sure to have the macro settings for Excel open and save the file as *.xlsm.
*Please fill out the Download Section (Click here) below the Comment Section to download the P-M Interaction Diagram: Circular Section Excel VBA!