 Get Started midas Civil
 Featured blog of this week

Linear and non-linear Buckling Analysis -
The right way to set it up
Table of Contents
Please click here to download the model files!
1. Buckling? What's that?
For concrete structures, we are usually quite happy with a beam FE model as it easily provides all the required results and design. However, as we move towards larger span structures, we realize that it’s just uneconomical and impractical to design the structure as just reinforced or prestressed concrete. That’s when steel-concrete composite construction comes to the rescue. The steel-concrete composite bridge has massive advantages over traditional concrete structures in terms of strength, self-weight, aesthetics & so on.
However, an elegant structural solution usually involves a lot of engineering complexity (There’s always a catch!). Fatigue & buckling are two such issues that need to be considered in the steel-composite design. In this article, we’ll limit ourselves to buckling.
For those new to the concept, buckling is defined in a practical sense as a sudden change in geometry of the structural component (instability) due to a specific incremental loading pattern. If a structure is subjected to a gradually increasing load, there will be a critical load at which there will be sudden deformation, and at this point, the structure is said to have buckled. The corresponding load is the buckling load. This failure mode is quite prominent for steel structures owing to their flexibility or “slenderness.” In other words, buckling is instability that occurs when the material has a higher load carrying capacity, but the geometry has become unstable.
Buckling is mainly classified into different types like lateral torsional buckling, flexural buckling, etc., based on the buckled shape. Another classification is based on the analysis properties. Linear buckling analysis & geometric-material non-linear analysis. Most of these terms could be googled for a nice theoretical article on the subject. But, in this article, we’ll stick to practicality.
2. The Worst Imperfection
It’s next to impossible to fabricate a steel section without any residual stress or minor deviation from the absolute perfect geometry. There must be rolling, hammering, welding, and so on, not obtaining the required fabricated shape, which in turn leads to imperfections. All the structural design codes have certain guidelines on tolerance for these deviations. It is mentioned in Eurocode 1993-1-6, section 8 that imperfections like deviations from nominal geometric shape, irregularities near welds, deviation from nominal thickness, lack of evenness of supports as well as few material imperfections are to be considered to assess the effect of allowable tolerance in fabrication on the buckling capacity. It also mentions that eigenmode-affine patterns should be used to introduce imperfection. And that the “most unfavorable” pattern should be used.
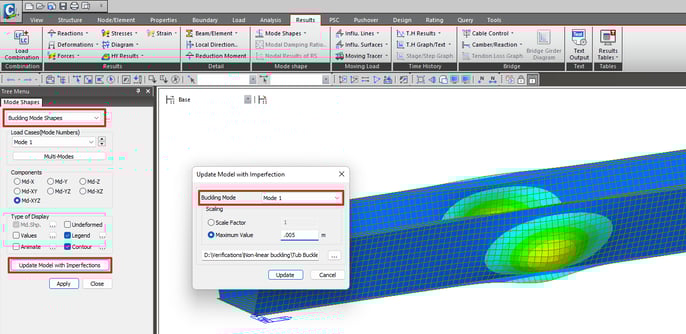
It’s quite ambiguous to arrive at critical imperfection. Nonetheless, it's required, And generally, engineers consider the first mode imperfections as the most critical. In midas Civil, this can be done quite easily (Fig 1). Imperfections based on the most critical eigen mode for buckling could be directly saved as an imperfect model. Once that’s done, material non-linear properties are defined, and the non-linear analysis is done.
One another approach is to perform geometric & material non-linear analysis on the perfect geometry of the shell structure and then update the imperfections in the structure based on the deformations obtained from this model. This may even lead to a lower critical buckling load! More on that here:
https://enterfea.com/imperfections-in-buckling-design/
3. Ok, now let's do it!
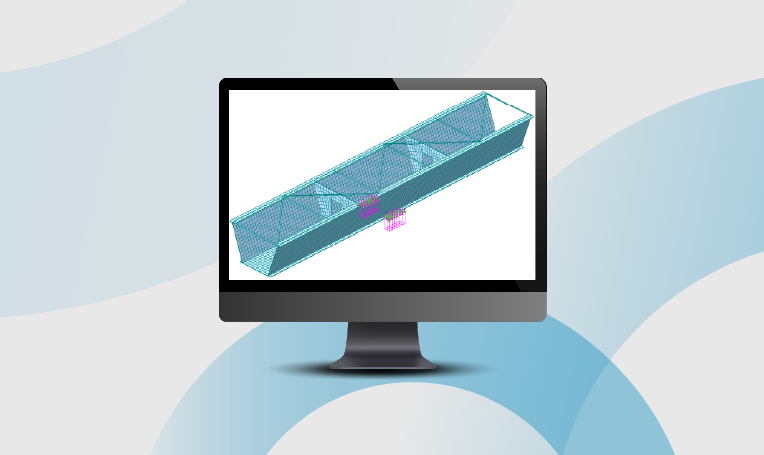
Now that we know about the basics of what needs to be done, let’s consider applying the knowledge to a simple structure! We’ll consider a single-span steel composite section subjected to upward pressure around mid-span (erection load), exactly below the webs (Fig 2).
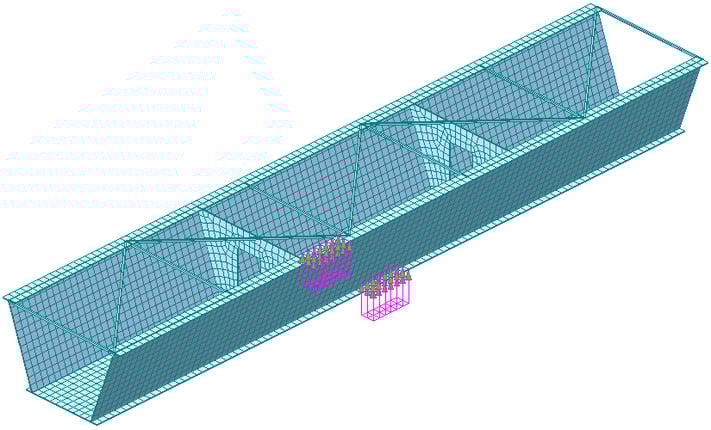
Clearly, we’ll consider the structure in a non-composite state, i.e., without the concrete deck, since steel alone is more prone to buckling failure, and this check is more critical during the construction/handling of the steel tub alone.
I won’t dwell on the basics of how to model the geometry & define the linear properties. We’ll start by setting up the linear buckling, which is step 1. Once the geometric modeling, loading & boundary assignment is done, linear buckling analysis parameters could be easily set up using the options shown in the image below (Fig 3).
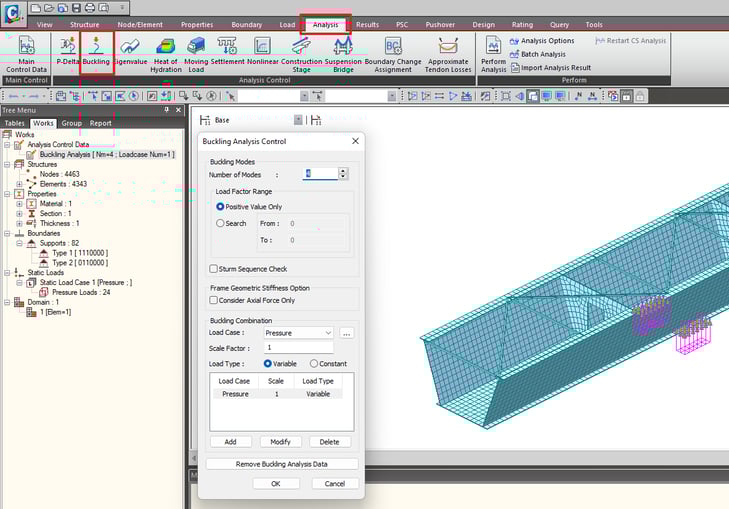
Enter the number of modes. The first mode is the critical buckling mode, but it may not be the critical imperfection. So, you may enter as many modes as you’d like to update for imperfection. The loading pattern which is considered for buckling load has to be set up as a “Variable” load type. Our sample model obtained the first eigenmode value as 1.269. So, based on linear buckling analysis, the critical pressure load is 1.269 times more than the currently applied pressure load.
After performing the analysis, we can save the imperfect model based on buckling modes, as shown in Fig 1. For now, let's do this with a 5 mm imperfection for the first four modes.
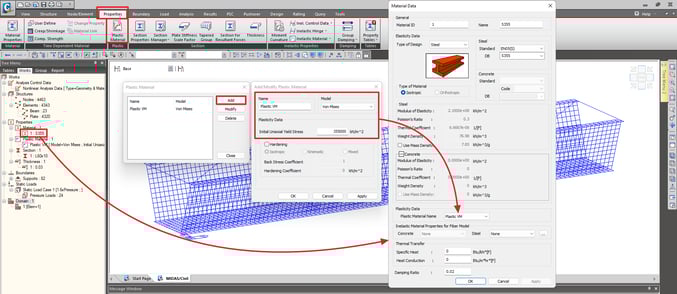
Step 2 is to set up the non-linear material properties & parameters for geometric & material non-linear analysis. In the imperfect models that have been created, set up simple plastic material properties using the Von Mises criterion (Fig 4). We won’t consider any post-failure behavior right now since that’s not what we are studying.
Once this is done, we’ll increase the loading magnitude to 1.6 times the initial pressure load. We did this so that we can clearly see how the structure is going to buckle and at which exact load factor.
Then, we set up the non-linear analysis control (Fig 5).
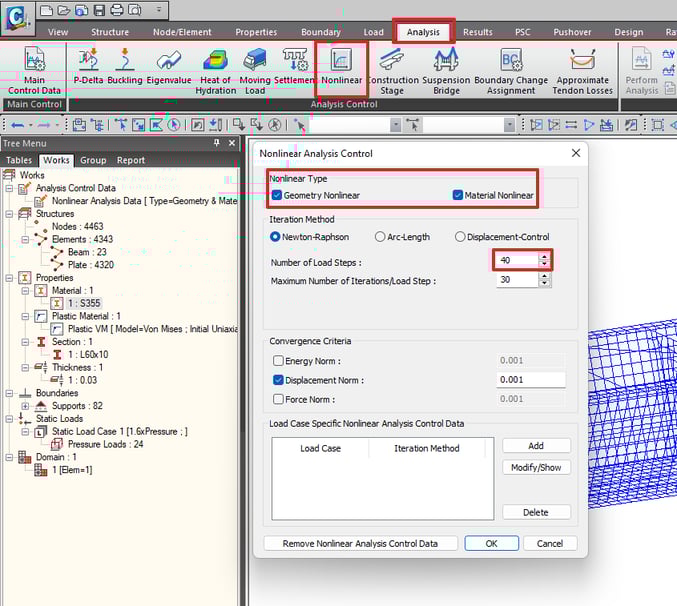
Both geometric & material non-linear options are checked, and we set up the total number of load steps as 40. This means that in each load step, the load would be increased by a magnitude of (1/40) x 1.6 x Pressure. This is important because, in non-linear analysis, the structure's stiffness matrix is updated after each load step based on the deformed shape and forces in the structure.
It could be noted that on performing analysis, there is a warning message that the analysis hasn’t converged. That’s alright. We can’t expect a totally unstable (buckled) model to converge in FE. So, we’ll restrict ourselves to the last step that converged, the 37th load step. We note down the node number having a maximum displacement in the 37th load step and plot a graph for the deformation at this node for all the load steps (Fig 6).
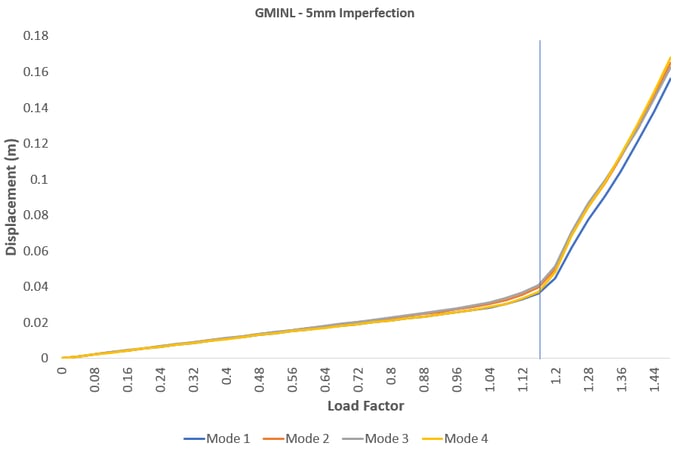
It can be noted from the image above that in our case, the buckling load is the same for all the different modes of imperfection, i.e., about 1.16 times the initial pressure load. This is lesser than the one that we obtained from the linear buckling analysis. At this point, most of the engineers would be satisfied that they’ve obtained the critical buckling load. However, if I am to nit-pick, it could be noted that Mode 1 imperfection is giving marginally lower deformation at final step as compared to the other modes. So, its quite difficult to judge the “most unfavourable” pattern as required by the code and it certainly won’t be Mode 1 for this structure.
We still have one unsolved mystery. We considered just 5mm as imperfection, whereas the code-based tolerance could have been much higher than that. So, why did we just consider 5mm? If higher magnitudes of imperfections are considered, then we face two issues.
- a) The model may not converge for the defined loading & load steps
- b) The displacement vs load factor curve becomes smoother, and it becomes quite difficult to point out the exact location of buckling load from the charts
You can try experimenting with the attached model files to verify these issues.
4. What we learned
In a nutshell, our learnings could be summarized as:
- a. Critical imperfection for non-linear buckling may not be the deformed shape per the first mode of linear buckling
- b. Higher magnitude of imperfection does not necessarily lead to better assessment of non-linear buckling load factor
- c. Midas Civil could be used to perform linear & non-linear buckling in steel structures quite effectively!