 Get Started midas Civil
 Featured blog of this week

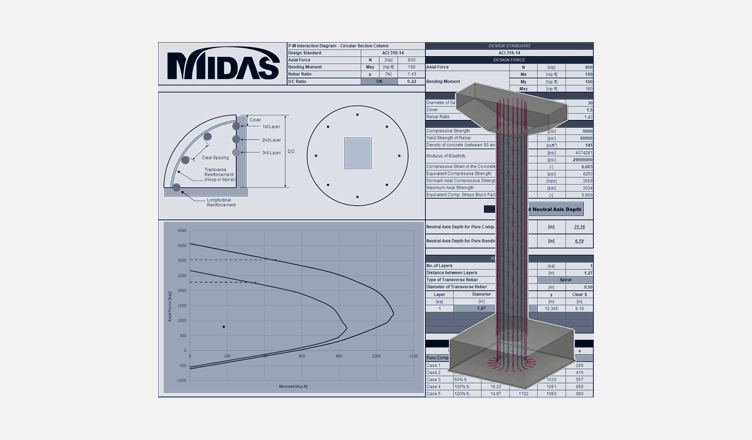
Please fill out the Download Section (Click here) below the Comment Section to download the P-M Interaction Diagram: Circular Section Excel VBA!
Table of Contents
*Click the content to move to the section
1. Why do we need P-M interaction curve?
2. How to generate interaction diagrams for reinforced concrete columns?
3. How to predict the failure pattern for a given column?
4. How Midas offer a helping hand?
1. Why do we need P-M interaction curve?
As we all know, almost all compression members are subjected to moments along with axial loads, mainly due to accidental eccentricities of the loads and from supporting beams having unbalanced moments at the support locations, as shown in the figures. Thus, columns fail due to the combined effect of the moment and axial load, making it difficult for engineers to predict their failure pattern.
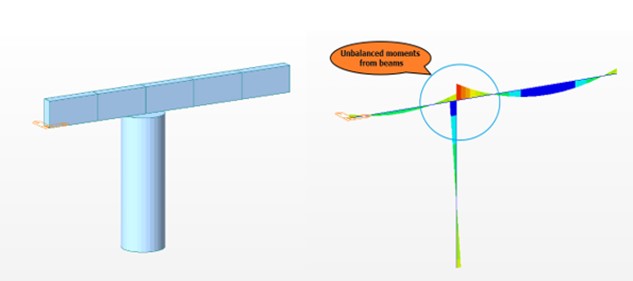
Figure 1: Unbalanced moments in column
Even though I will not dive deep into the definition of the P-M interaction curve, I will give a brief idea for our readers who have just started with the column analysis and design. The P-M interaction curve graphically represents the uniaxially eccentrically loaded column's design strength envelope. [Click here to learn more about the P-M interaction curves]
Unlike beams, different axial loads result in different failure moments, making it difficult for the engineers to predict the behaviour of the columns. But using the design interaction curve for that section, it will be possible to quickly judge if a given column section is "safe" under a given factored load effect combination (Pu, My, Mz). When the maximum stresses are achieved for such a column, failure will occur under compression.
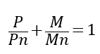
![]() The below equation is the interaction equation showing the relationship between, P and M at failure.
The below equation is the interaction equation showing the relationship between, P and M at failure.
2. How to generate interaction diagrams for reinforced concrete columns
Even though the above interactive equation seems quite simple, it will be tedious to calculate the ultimate forces generated in the columns for the loadings provided. Because of this, interaction diagrams for columns are typically calculated by assuming many strain distributions, each corresponding to a certain point on the interaction diagram, and then determining the corresponding values of Pn and Mn.
Thus, using the strain compatibility solution, once enough such points have been computed, the results are plotted as an interaction diagram.
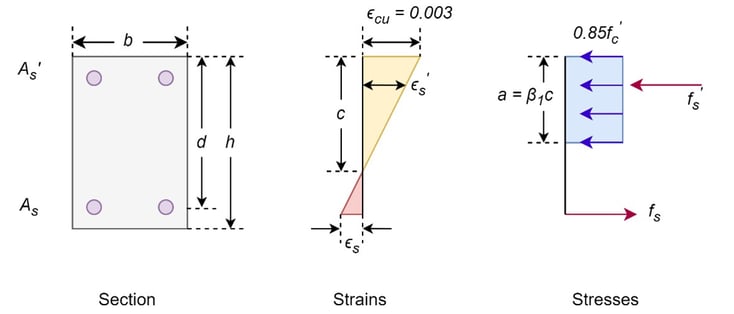
.jpg?width=734&height=357&name=Figure%202%20Stress%20strain%20distribution%20in%20column%20(2).jpg)
Figure 2: Stress strain distribution in column
The calculation process is illustrated in Fig. 2 for one strain distribution. The maximum compressive strain is set at 0.003, corresponding to the ACI Code definition of the maximum useable compression strain. The strain at each level of reinforcement is obtained from the strain distribution curve after selecting the location of the neutral axis.
The size of the compression stress block and the stress in each layer of reinforcements is computed from the above strain values. The forces in the concrete and steel layers, shown in Fig. 2, are calculated by multiplying the stress values by the areas on which they act. Finally, the axial force is obtained by summing the individual forces in the concrete and steel. The moment is calculated by adding the moments of these forces about the geometric centroid of the cross-section. The interaction curve is obtained by plotting Pn and Mn. Other points on the interaction diagram can be generated by selecting different values for the depth, c, to the neutral axis from the extreme compression fibre.
3.How to predict the failure pattern for a given column?
As I mentioned above, we can predict whether the column subjected to a particular loading will fail or not. Consider a column subjected to an axial load 100 kN and a moment of 150 kNm. The column will fail if the point (150,100)) is lying outside the interaction curve.
Now, for a particular eccentricity, we can obtain the maximum moment and axial load that can be applied to the column without failing by drawing a line with a slope of 1: e intersecting the interaction curve. That is by keeping M/P constant.
Likewise, one can also determine the maximum load and eccentricity at which it can be applied for a particular moment. That is by keeping the M constant (Fig.). Similarly, we can also compute the moment and the maximum eccentricity at which a specific load can be placed to avoid the failure of the column.
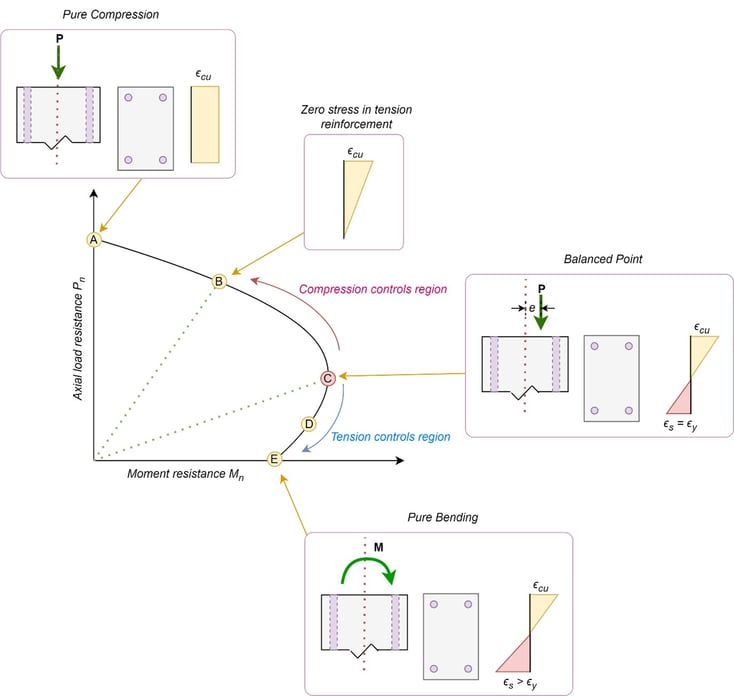
Figure 3: P-M interaction curve for a column under uniaxial bending
Point A—Pure Axial Load. Point A in Fig. 2 and the corresponding strain distribution represent uniform axial compression without moment. This is the maximum axial load the column can support.
Point B—Zero Tension, Onset of Cracking represents the crack onset of the column's least compressed side. Since tensile stresses in the concrete are ignored in the strength calculations, failure loads below point B in the interaction diagram represent cases where the section is partially cracked.
Region A–C—Compression-Controlled Failures. Columns with axial loads and moments that fall on the upper branch of the interaction diagram between points A and C initially fail due to crushing the compression face before the extreme tensile layer of reinforcement yields. Hence, they are called compression-controlled columns.
Point C—Balanced Failure, Compression-Controlled Limit Strain. Point C in Fig. 11-13 corresponds to a strain distribution with a maximum compressive strain on one face of the section, and a tensile strain equal to the yield strain, in the layer of reinforcement farthest from the compression face of the column. The extreme tensile strain occurs in the outer tensile layer of steel below the extreme compression fibre. This point can be defined as a balanced failure in which the crushing of concrete on the compressive face and yielding the reinforcement nearest to the opposite face of the column (tensile face) develop simultaneously.
Point D—Tensile-Controlled Limit. Point D corresponds to a strain distribution with 0.003 compressive strain on the top face and a tensile strain of 0.005 in the extreme layer of tension steel. The failure of such a column will be ductile.
Region C–D—Transition Region. Flexural members and columns with loads and moments which would plot between points C and D in Fig. 3 are called transition failures. The mode of failure is transitioning from a brittle failure at point C to a ductile failure at point D.
4. How Midas offer a helping hand?
Now think about calculating the P-M interaction curve for irregular piers under biaxial loading. But don't worry. We have got your back. Midas provides a 3D curve representing the interaction between axial force and the moments in Y and Z directions, enabling the users to check the columns' capacity under biaxial moments. Midas also offers the General Section Designer module, which enables the user to calculate the section properties and section capacity for irregular columns. Click here to learn more about the GSD module.
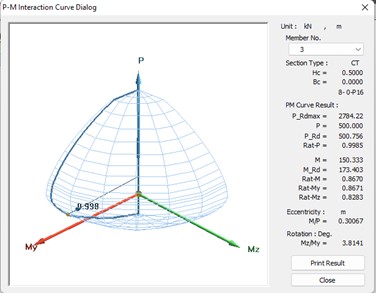
Figure 4: 3D P-M interaction curve from Midas
Now let us discuss the three options available in the GSD module of Midas and how each option considers the capacity of the section: M/P constant, M constant and P constant. I have considered a circular column subjected to an axial load of 150 kN and a moment of 100 kNm.
Usually, the design capacity of columns is calculated by keeping M/P constant, as shown in fig. 4. This method can be used when the column has considerable axial load and moment.
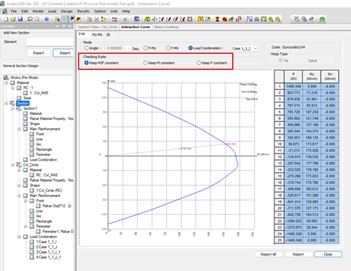
But in most cases, axial load predominates the moment. In these circumstances, the designer tends to keep the M constant and designs the section for a much higher axial load.
In some cases, due to space restrictions, engineers will be forced to provide cantilever pier caps, thus resulting in a high moment in the columns compared to axial loads. In these circumstances, the columns are designed by keeping the P constant, thus designing the section for a higher moment.


/(BI)%20What%20is%20the%20Influence%20Line%20and%20Surface%20Analysis%20on%20bridges/Influence%20Line%20%26%20Surface%20Analysis%20on%20Bridges%20345%20240.png)